OutThink collects diverse data throughout employees’ training campaign participation. This data serves dual purposes: compiling training campaign statistics and conducting risk analysis based on employee profiles.
The campaign dashboard has the following sections:
HEADER

This dashboard header streamlines the management of your training campaign. It provides quick access to settings, the ability to download general reports, and displays campaign metadata, bringing all relevant information to the top of the page.
CAMPAIGN SEND PROGRESS

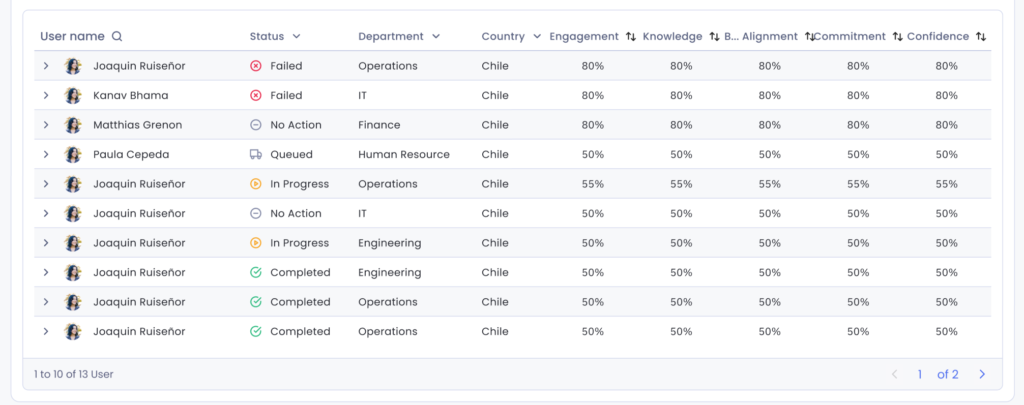
For large campaigns, track how many emails have been sent to users, and how many remain in the queue. Users who are waiting to receive the email are tagged as status ‘Queued’ in the user table:
CAMPAIGN OVERVIEW

The data in this section offers a quick overview of the current campaign state. It aims to answer the following questions:
- How are employees rating the content, and how many reviews were submitted?
- How many employees are enrolled, and what is the progress distribution? What is the overall completion rate?
- What are the average engagement and knowledge scores that the enrolled employees achieved?
- What is the average time employees spend undertaking the training?
- Who hasn’t completed the training? (quick clicks)
- Training countdown (replaced with the reminder conversion rate when automated reminders are activated)
COMPLETION
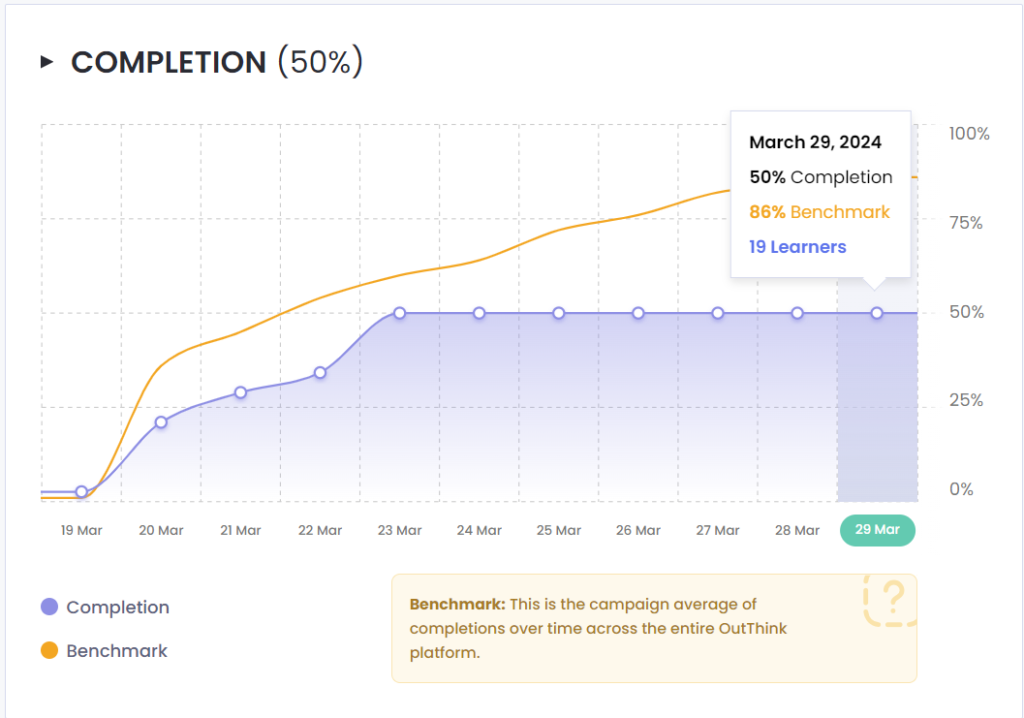
Check how many learners have completed their training and see how you compare with platform benchmarks.
This section answers the following questions:
- How quickly are my learners completing the training?
- What is the platform completion benchmark?
- How many learners have completed the training at any specific date?
WHAT LEARNERS SAY
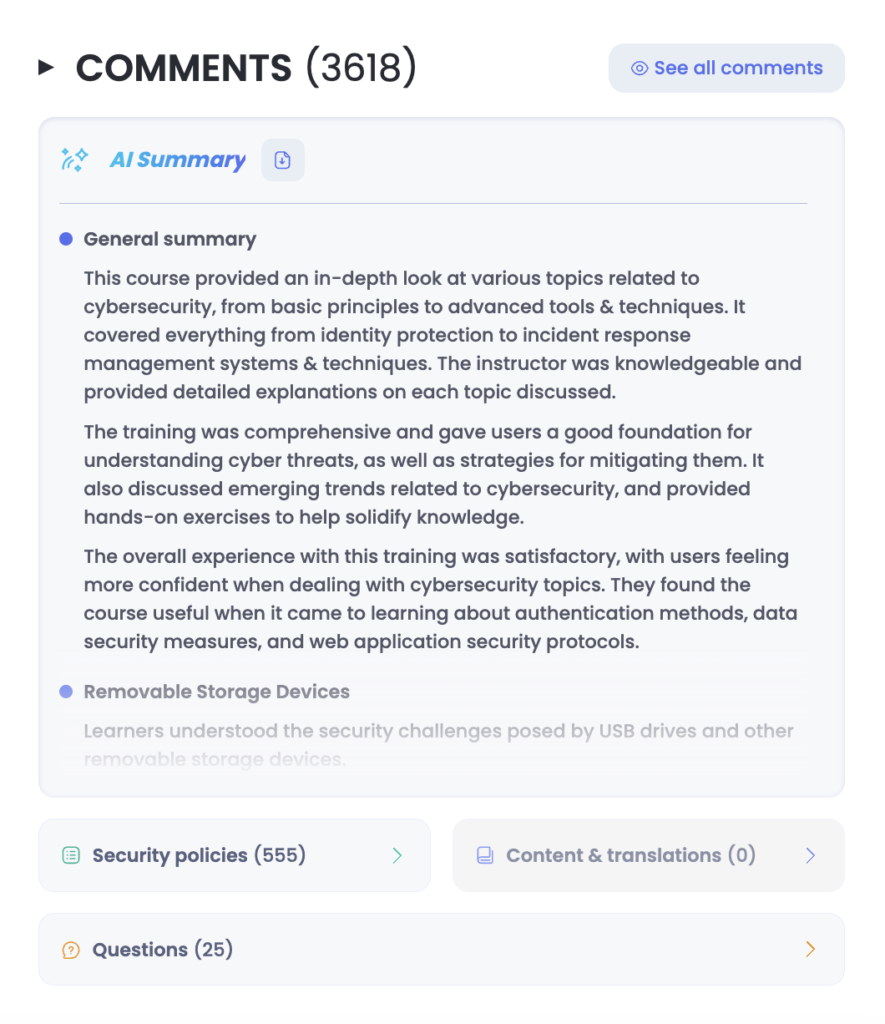
This section displays learner comments from their security awareness training campaign, providing valuable insights. You can filter out less pertinent feedback to focus on the most informative comments. (all exportable).
- AI Summary: offers learners’ comments summaries at the general campaign level and at the module level.
- Questions: all comments detected as questions are segmented here for further analysis.
- Security policies: displays comments that specifically refer to the security policy and culture of the organization the learner belongs to. These insights can help you understand how learners perceive and interact with your security policies.
- Content & translations: feedback from users on their sentiment towards the training content and language translations.
By clicking on ‘See all comments’ you can see which of your colleagues provided each comment:
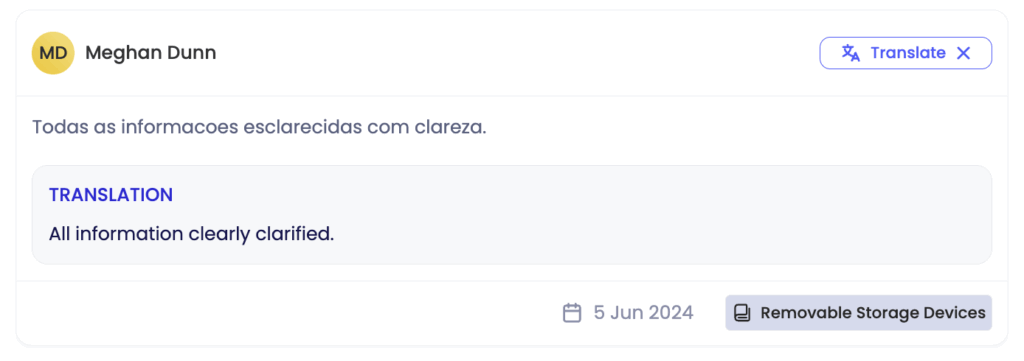
By exporting the questions and/or comments you can see which module the comments are related to.
INSIGHTS
Human sensors (only for curriculum campaigns):
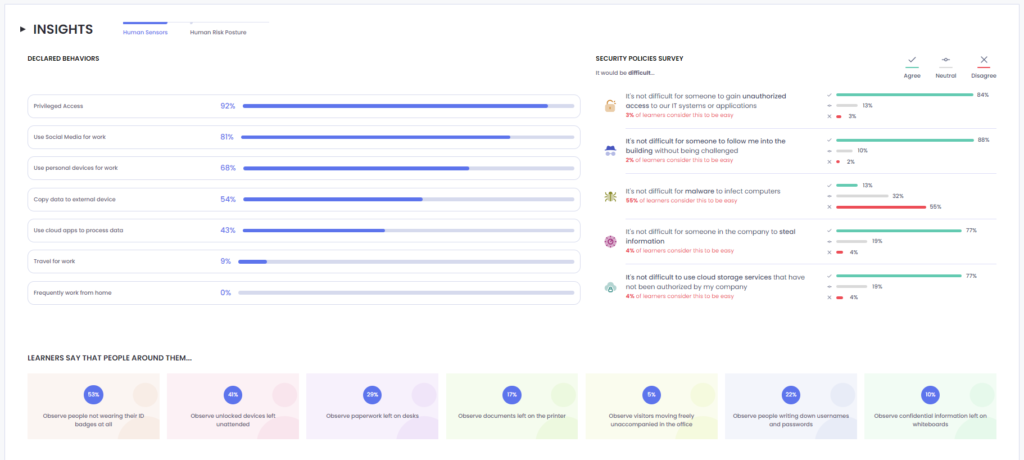
This section called “human sensors” seeks to show you a holistic view of your learners collected from answers on the Initial Assessment of your curriculum campaign. There are 3 sections:
- Declared behaviours: these are self-declared behaviors that learners declared to be relevant to their jobs.
- Security policy survey: learner’s personal “views” on specific security policies applying to the company.
- Learners say that people around them: these are behaviors learners see happen around their work environment.
All of these sections are clickable, filtering the ‘Learners’ table below.
This section looks to answer questions such as:
- What are some risky behaviors my learners might incur due to the nature of their job role?
- Which cybersecurity policy is currently not being followed?
- What are some of the risky behaviors happening in specific environments?
LEARNERS

The data in this section provides detailed individual performance information for each employee. It allows administrators to see:
- What is the status of each user’s training progress?
- What are their engagement and knowledge scores?
- When was the user added to the campaign?
- When were reminders last sent to this user?
- What training modules were assigned to the user?
- When did the user complete each individual module?
- What rating did they give each individual module?
- What is their unique training hyperlink to access the campaign?
- What were their individual Final Assessment score and outcome (Pass or Fail)?

All data regarding the users’ performance in relation to training completion is available for CSV export. The most detailed report is: Module allocation & completion, while the more condensed format is the User Progress report, which is often used to upload into a GRC system, or provided to auditors.