The aggregate training dashboard provides an overview of the data captured from all curriculum and instant campaigns carried out on the platform. Please note the aggregate training dashboard will only capture data starting 8th of April 2023.
CAMPAIGN OVERVIEW

- Filter options:
- Group
- Organization
- Business unit
- Time (currently limited to year-to-date)
- Learners: The total number of active users in the system.
- Campaigns: The total number of campaigns created. On hover, this item displays a breakdown by campaign status (i.e. Scheduled, In Progress, or Completed).
- User training status: The proportion of learners in all campaigns who have completed, not started or are currently in progress.
- Total time spent: The total time spent across all training campaigns.
- Avg time per user: The average time employees have spent in all training campaigns.
- Engagement: The average level of learner engagement across all training campaigns. Clicking on this tile displays a timeline tracking this metric, and breaks the metric down by training topic
- Knowledge: The average level of learner knowledge across all assessments. Clicking on this tile displays a timeline tracking this metric, and breaks the metric down by training topic
- Productivity impact: Displays the average productivity impact reported across all training campaigns. Clicking on this tile displays a timeline tracking this metric, and breaks the metric down by training topic
- Compliance: Shows the average level of employees’ intention to comply with recommendations, gauged across all training campaigns. Clicking on this tile displays a timeline tracking this metric, and breaks the metric down by training topic
- Confidence: Displays the average level of employee confidence reported across all training campaigns. Clicking on this tile displays a timeline tracking this metric, and breaks the metric down by training topic

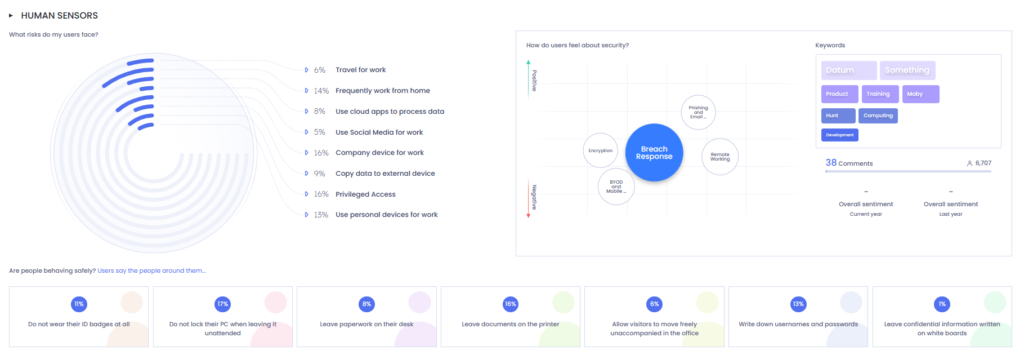
Human sensors
This section is similar to the single training dashboard, but it aggregates data across campaigns. It provides an overview of the current state of employees’ perceptions, including potential risk factors, observations of physical security measures, and summarized comments on training and policy.

Department performance

Like the single training dashboard, this section enables administrators to compare all departments, sort them based on various criteria, or search for a specific department.
Country and user performance

The section allows administrators to explore individual user scores and average country performances across six metrics:
- Completion
- Knowledge
- Engagement
- Productivity
- Compliance
- Confidence